
The 8 step workflow to create hyperpersonalized, interactive presentations with Claude Code
It will be your biggest productivity hack.

Last month, I was on a video call with a founder friend. He was looking at my deck and said:
“Move your weighted ARR graph to the left and list all of your deals with name, ARR and weighted ARR as a table on the right side of the slide.”
As he talked, I turned Wispr Flow on, which pasted the transcript straight into Claude Code. I pressed enter.
We kept talking. About a minute later, everything he had just described appeared on screen, live, in front of his eyes.
He paused. “Wait, what?”

That moment captures why I stopped using PowerPoint. I build all my presentations in HTML now (and essentially any document). Not because I’m a developer, but because it’s genuinely faster, more powerful, and gets better with every deck I make.
But getting here wasn’t obvious. It was my single biggest productivity breakthrough this year.
In this article I will show you:
why building presentations with HTML is not only 10x faster, but also 100x more stunning output. It’s interactive, animated and beautiful.
a step-by-step workflow to get started
How I got here (the hard way)
For months, I was sitting at my desk creating presentations for clients non-stop. Sales decks, partnership proposals, investor updates. Deck after deck after deck, all in PowerPoint. By that point I had moved almost everything else into AI workflows. Emails, research, analysis, code. But presentations? I was stuck. PowerPoint was the one thing I couldn’t crack.
My designer actually told me I had “AI aggression.” Not because I was using AI too much, but because I was frustrated whenever I couldn’t. I was spending all my time on manual PowerPoint work instead of automating it, and it was making me feel unsettled. I knew there had to be a better way, but I was stuck.
Finding the solution took a few failed attempts.
01 Claude Web: Limited
Generating PowerPoint slides through Claude’s web interface. Results were okay, but design was really off and super basic. It still needed a lot of rework from my side.
02 Claude PowerPoint Plugin: Better, but still stuck
The Claude-in-PowerPoint plugin. Better, but still limited by what PowerPoint allows you to do programmatically. The format itself was the bottleneck, not the AI.
03 Claude Code: The breakthrough
A conversation with a Series B founder. He asked me how he could create fundraising documents with AI. Without thinking, I said: “Just create them as websites.”
And then I heard my own answer.
If I was telling other founders to build fundraising documents as websites, why was I still making my own presentations in PowerPoint? Why not create presentations as websites?
That was the moment. Everything clicked.
What this actually looks like
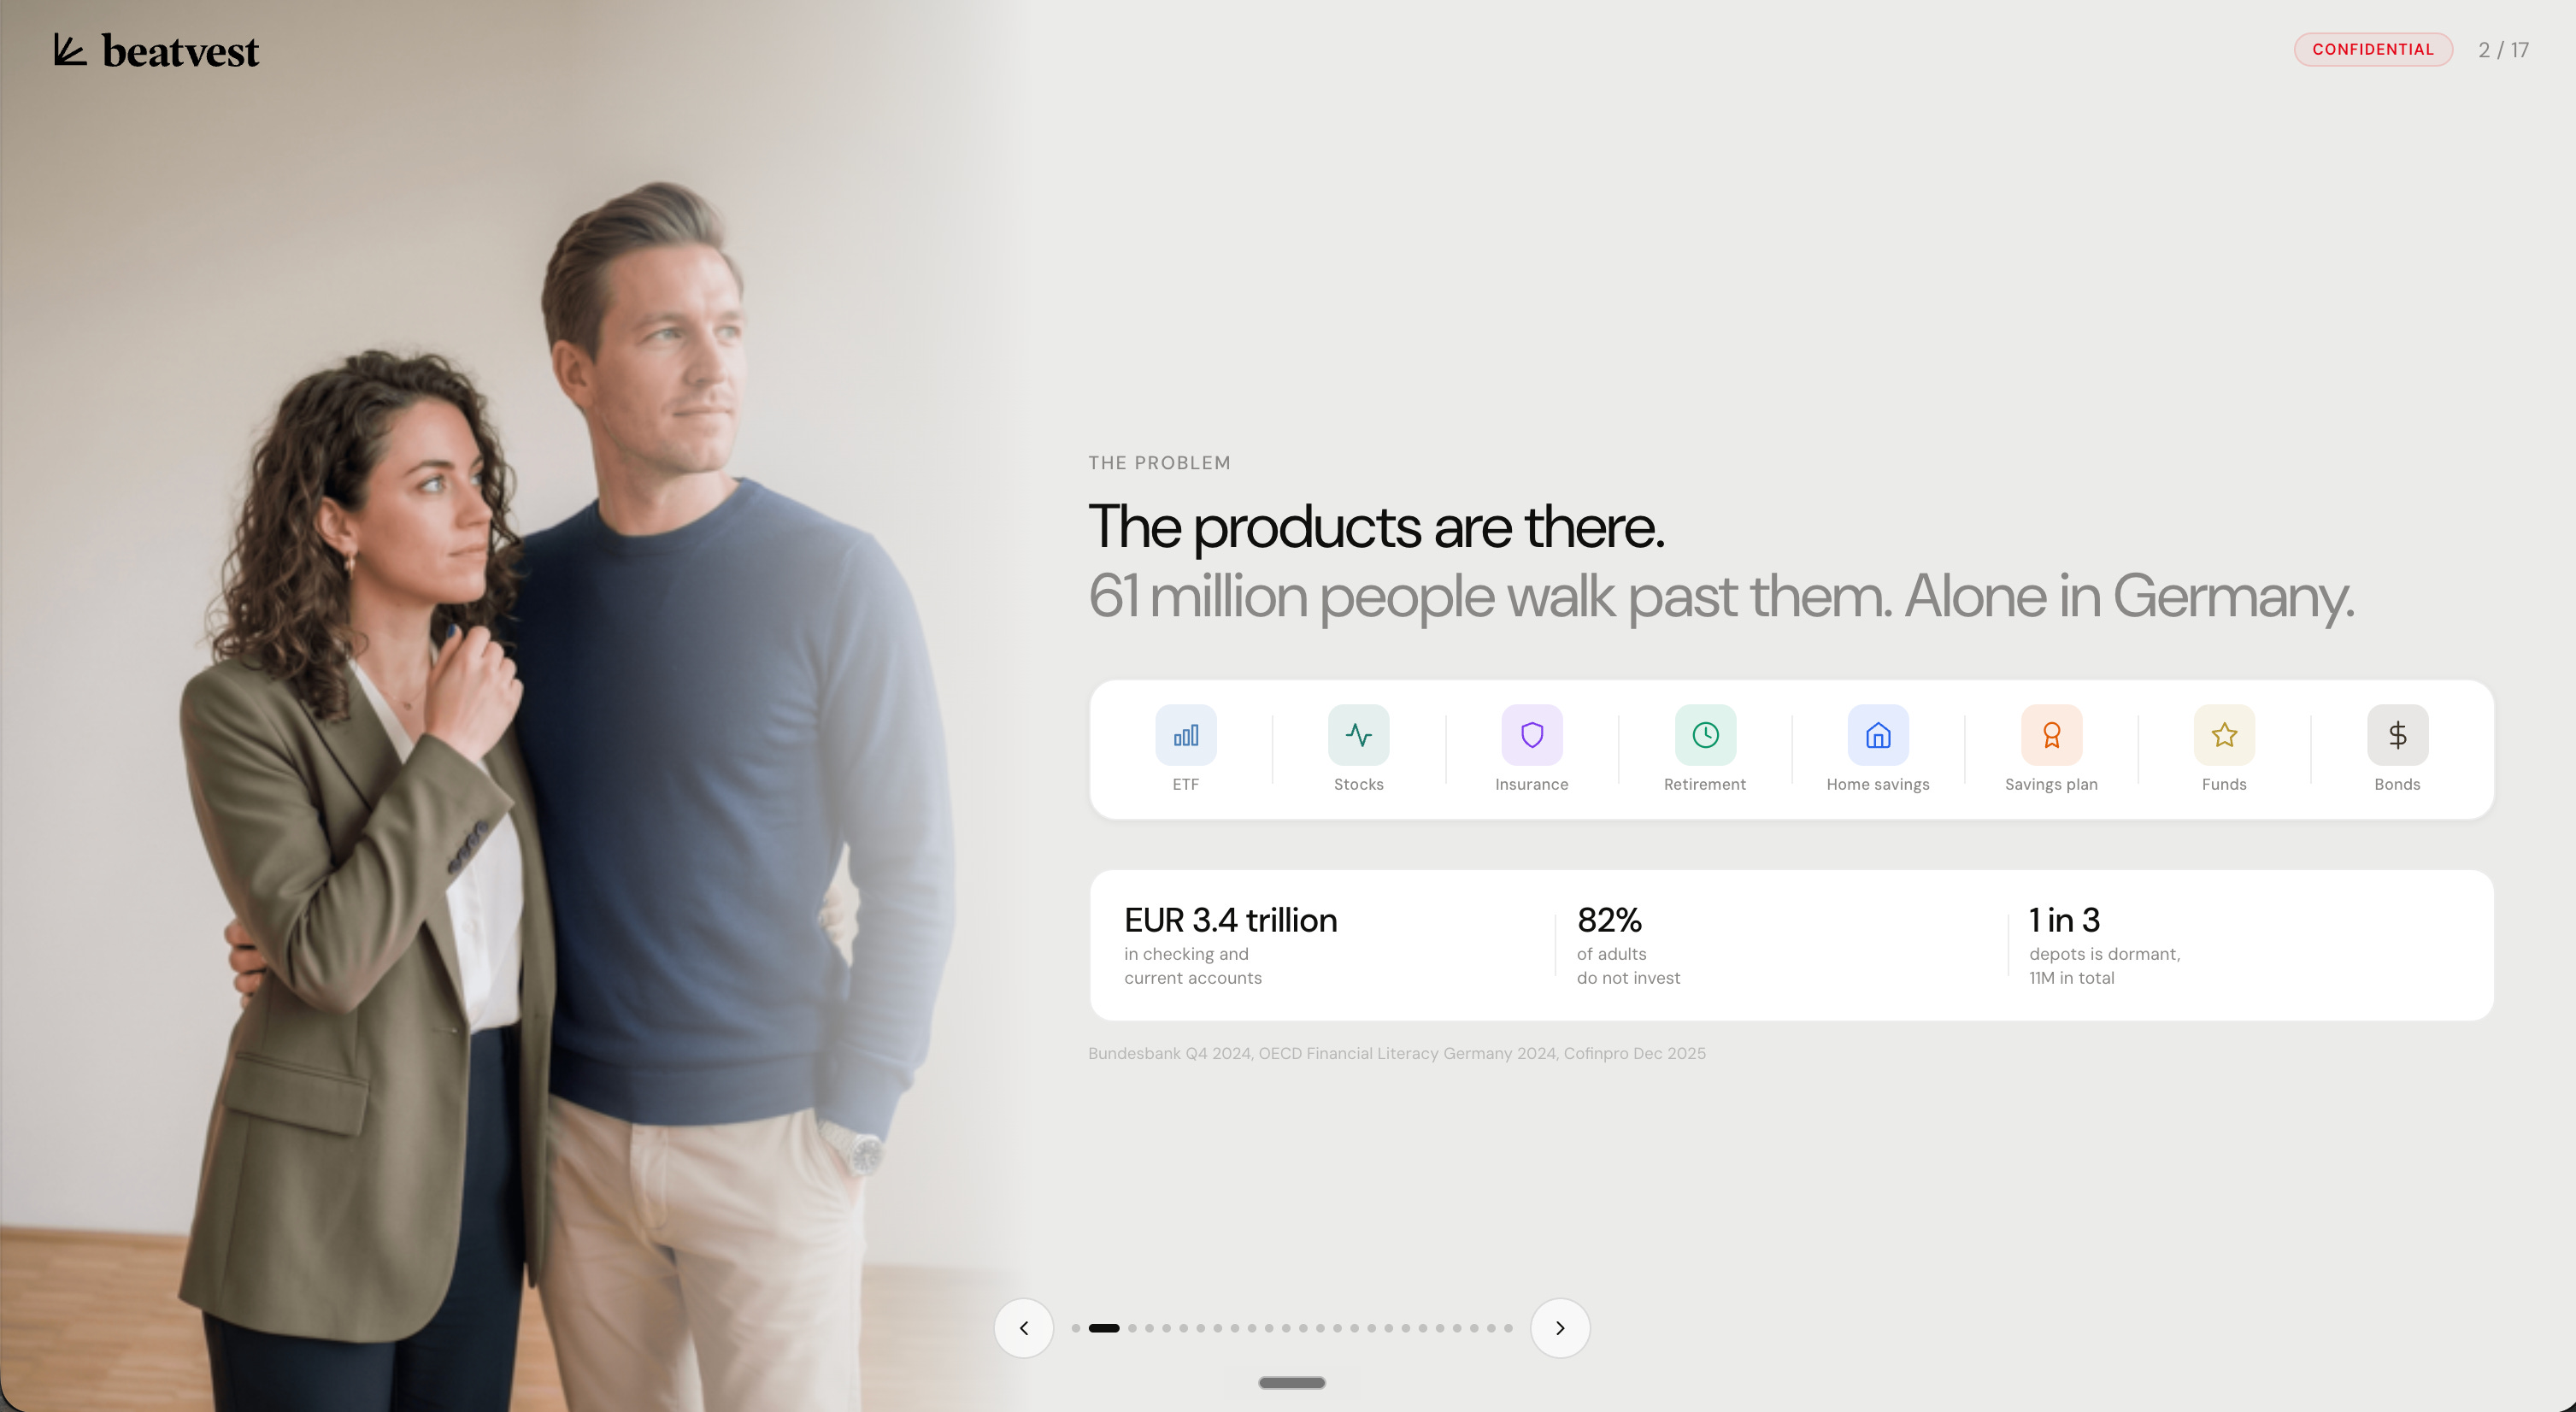
My presentations are single HTML files. Websites that look like Google Slides. You open them in a browser, click through slides with arrow keys, and they look polished, professional, branded.
Behind the scenes: I have a CSS design system (basically a style guide that lives in one file) and Claude Code as my builder. I describe what I want, and it automatically builds the deck.
When I need a new sales deck for a banking partner, I tell Claude Code the partner name, their brand color, and what the deck should cover. Minutes later, I have a complete, branded presentation. In PowerPoint, the same process used to take me hours.
7 ways to build killer presentations with HTML
01 You talk. It builds. No iteration cycles.
This might be the biggest gamechanger. Think about how presentations normally get made at a startup. You brief an employee. They come back in two days with a first draft. You give feedback. They revise. Your co-founder has notes. Another round. Someone on the team changes the copy. Another version. By the time the deck is “done,” it’s been through four people, three rounds, and a week of calendar time.
With this workflow, I talk to Claude Code the way I’d brief an employee. I describe what I want, Wispr Flow captures it, and the output is there in minutes. If my cofounder sends me feedback, I paste the feedback straight from Slack into Claude Code. It does the work. Done.
This is how a deck looks like:
02 Personalize decks from transcripts and research
Before a sales call, I push the transcript of previous conversations into Claude Code. “Adapt the deck to emphasize the topics the partner cared about. Reference the specific pain points they mentioned.”
The deck reshapes itself around what that specific prospect actually said. Not a generic version with their logo slapped on. A version that speaks directly to their concerns, their language, their priorities.
Try doing that in PowerPoint. You’d spend an afternoon manually rewriting slides. Here, it takes a prompt and two minutes.
03 Start agents that research and adapt your deck
This goes beyond simple prompting. I can create AI agents in the same interface that research a prospect, pull relevant data, and adapt the deck accordingly. The agent reads about the company, understands their market position, and tailors the messaging.
The presentation becomes a living document that reshapes itself based on intelligence, not just a static file you manually update. I would prompt it like this “Spin up an agent, who researches partner xyz, their pain points and strategic priorities. Afterwards, match how our solution fits into the goals of the partner. Then adapt the deck based on the findings”.
04 Create interactive elements that make your audience lean in
You can build interactive calculators right inside your presentation. A pricing calculator that lets a prospect toggle their user count and see their ROI in real time. A cap table simulator where investors drag a slider to see how different round sizes affect dilution. A unit economics dashboard where you change CAC or churn and watch LTV and payback period recalculate instantly.
Think about the things you present to investors, partners, or your board over and over: financial scenarios, sensitivity analyses, cohort retention curves, competitive positioning. In PowerPoint, these are frozen screenshots. In HTML, they’re live, interactive tools that your audience can play with. The difference in how people engage with your content is night and day.
Here is an example of a calculator, that I built right into the deck:
